Choose the right report
- Availability
- Beta
- Last verified
- Last verified Sep 25, 2026
Use this article when someone asks for "a report" and you need to decide which surface actually answers the question. Start with Sales > Reports for the standard price-charged reports. Use the report builders on list pages for custom breakdowns, dashboards for a quick operational view, the attendee export for row-level data, and the order and Documents lists for sales records.
Before you start
- Confirm the exact question: attendance, tickets, revenue, orders, check-ins, or customers.
- Confirm the date basis the answer should use: visit date, booked date, or created date.
- Confirm whether "price" means the price category or the Price charged: the price quoted for the ticket, product, or voucher before any discount.
- The central product and voucher reports require invoice-read access without a restriction to assigned resources. Staff whose access is limited to assigned resources do not see these reports.
- The report builder appears as a Reports button on list pages where it is enabled for your account. If you do not see it, ask your account owner or KORONA Event support.
Match the question to a surface
| Question | Where to answer it |
|---|---|
| How many attendees, by event, price category, or channel? | Sales > Attendees > Reports: metric Attendees, break down by Event, Price Category, Point of sale, or Order channel. |
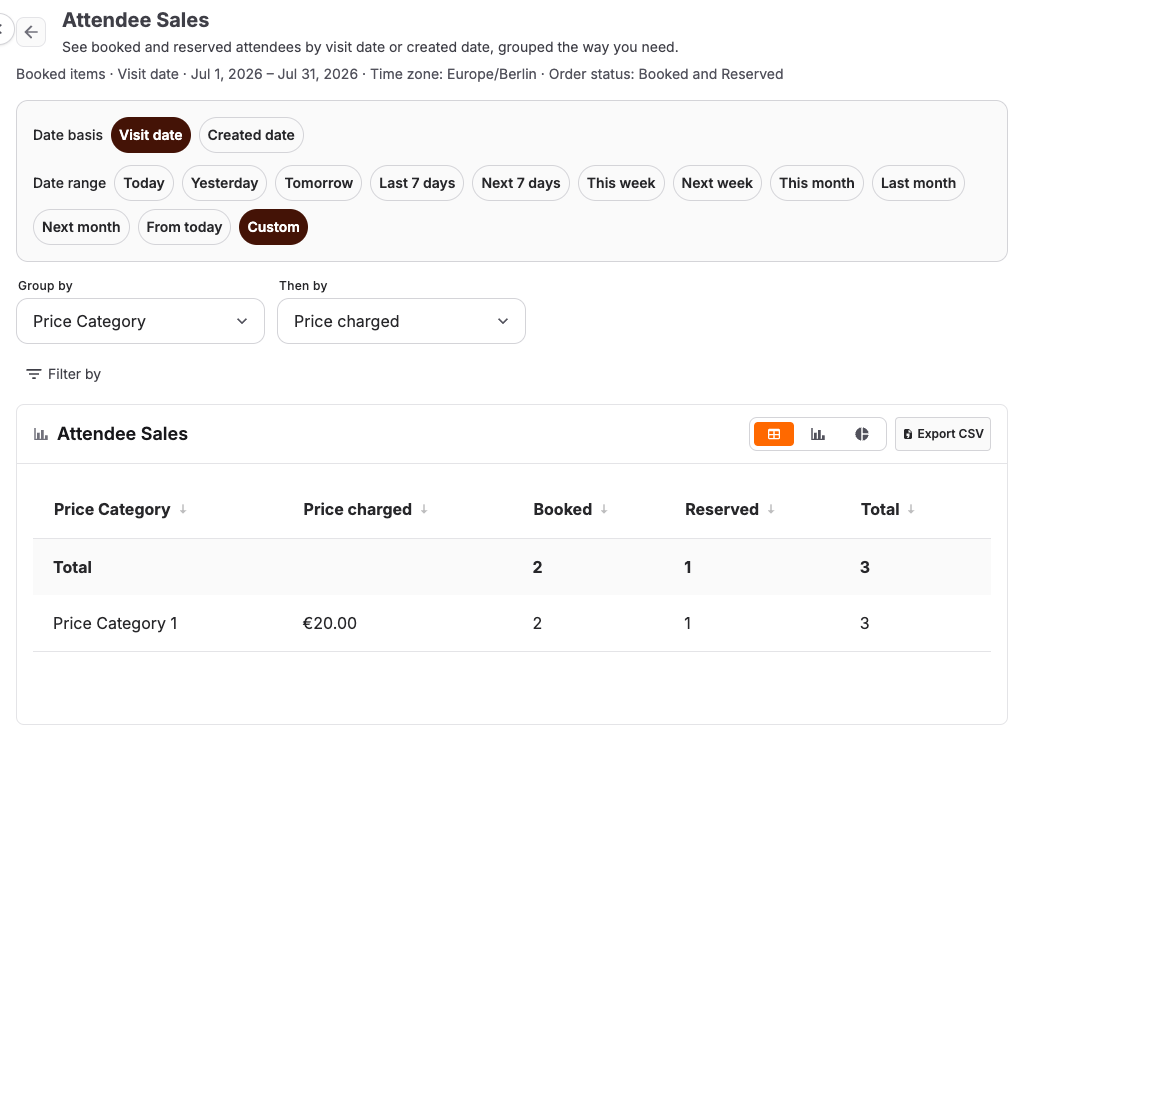
| How many attendees are booked or reserved for a period, including future dates? | Sales > Reports > Attendee Sales. Choose Visit date or Created date, pick a Date range such as Next 7 days, and group by Price Category, Product, Template group, Tags, or date. By default each price category is broken down by Price charged. The table shows Booked, Reserved, and Total. |
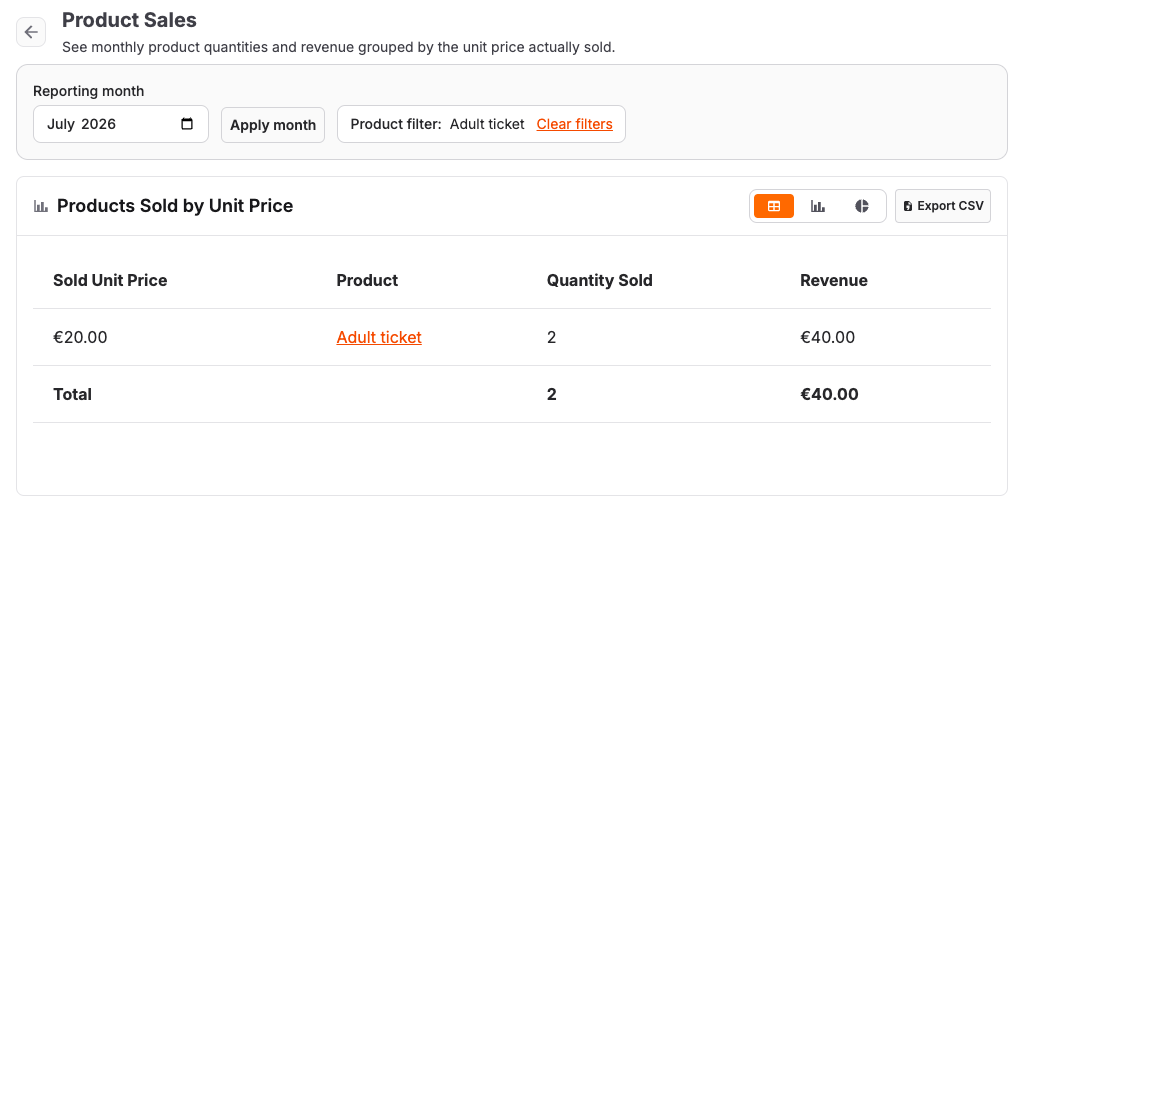
| How many products or vouchers were sold at each price? | Sales > Reports > Product Sales or Voucher Sales. Choose the Date basis and Date range. By default the report groups by product or voucher, Then by Price charged, and shows the number, Price charged, Quantity Sold, and (for products) Revenue. |
| How many attendees checked in? | For a quick total, open the event, admission, or event-template dashboard. For attendee-level detail, use Sales > Attendees and filter Checked in / Not checked in, or break down a report by Check-in Status. |
| How much revenue, by event, product, or voucher? | Reports on the Events, Event Templates, Admissions, Products, or Vouchers list: metric Revenue, gross from invoice and receipt line items. |
| How many orders, and what is the order value? | Sales > Orders > Reports: metrics Orders, Revenue, Attendees per Order; break down by Point of sale, Order Value, or Created Date. |
| New versus returning customers, repeat rate? | Sales > Customers > Reports: metrics Customers and Revenue, breakdowns such as Returning vs New and Orders per Customer, plus tiles like Total revenue and Repeat rate. |
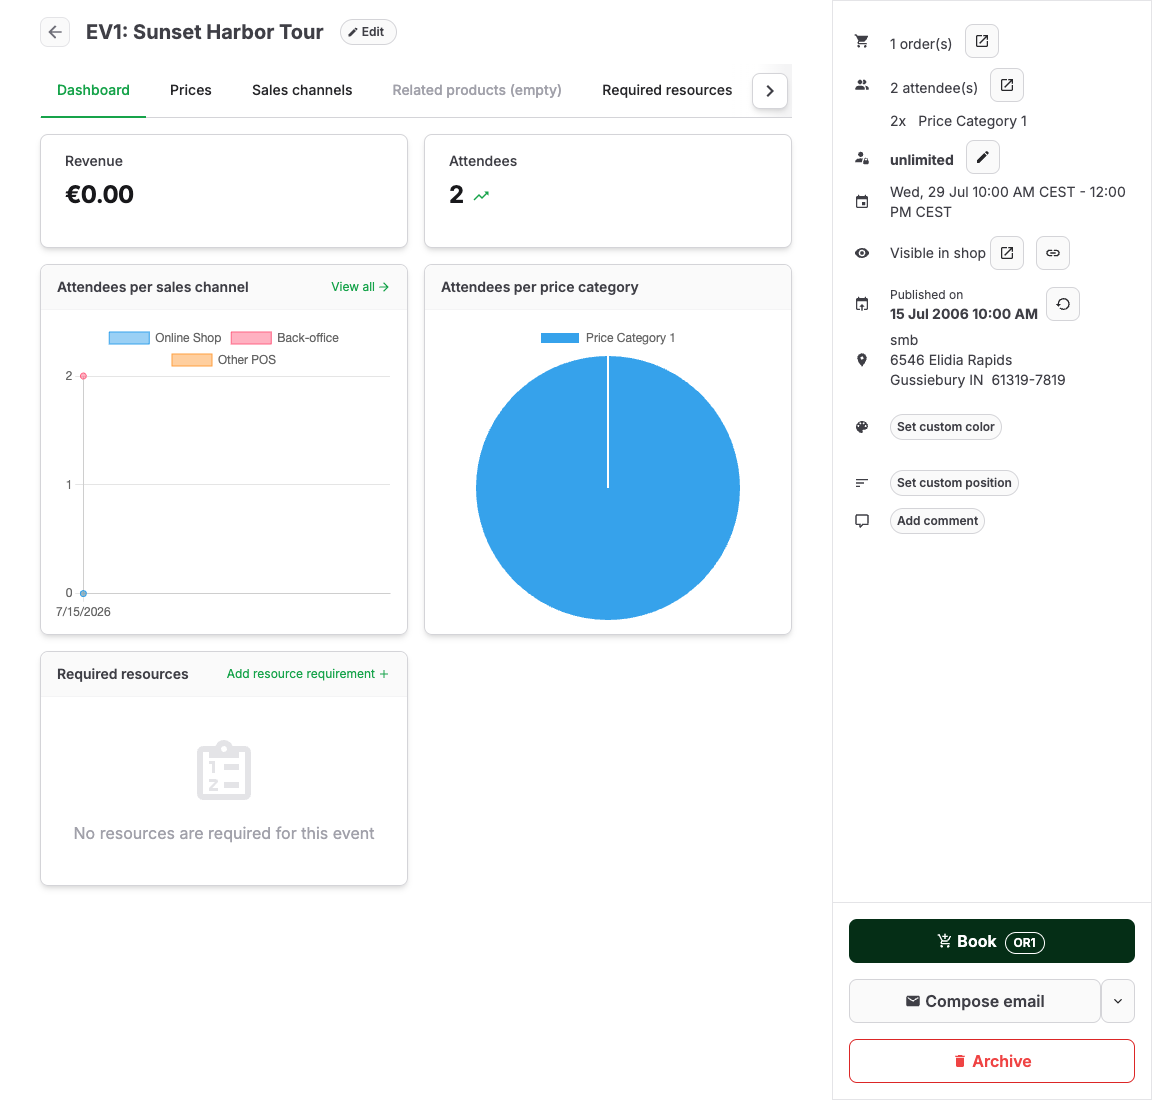
| Quick health check for one event? | The event dashboard on the event detail. |
| A guest list or attendee-level file? | The attendee list export (CSV or Excel), filtered first. |
| Accounting documents and payment states? | Sales > Documents, with Download invoice for invoice documents. |
| Answers to checkout or attendee questions? | Break down a report by Question, or include the answer columns in the attendee export. |
Choose date basis, grouping, and time zoom in Sales Reports
Sales > Reports opens three focused reports — Product Sales, Voucher Sales, and Attendee Sales — each with its own Date basis, Date range, Group by, Then by, and filter controls. The line under the heading always states what the report covers: the row subject, the date basis, the period, the time zone, any active filters, and — on Attendee Sales — the order status counted.
Date basis and range
Choose a Date basis: Booked date, Visit date, or Created date on Product Sales and Voucher Sales (Booked date is the default); Visit date or Created date on Attendee Sales (Visit date is the default). Then pick a Date range — a quick range such as This month or Last 7 days, or select Custom to choose your own range. Visit date also offers future ranges, such as Next 7 days, Next week, and Next month, so you can prepare for events that have not happened yet.
Group by and Then by
| Report | Group by | Then by |
|---|---|---|
| Product Sales | Product, Price category, Template group, Point of sale, Order channel, or date | Price charged, Bundle role, Event Template, Product, or date |
| Voucher Sales | Voucher | Price charged or date |
| Attendee Sales | Price Category, Product, Template group, Tags, or date | Price charged, Order status, Event Template, Product, or date |
- Price charged is the price quoted for the ticket, product, or voucher before any discount, so an article keeps one row per price charged and discounts do not create additional rows.
- Rows labeled In bundle are articles sold as part of a bundle rather than sold on their own. On Attendee Sales, they are attendees who came in on a bundle component, such as the adult tickets inside a family ticket; the bundle carries the price.
- Rows labeled No price recorded are lines or attendees without a recorded price, such as imported attendance records.
- A Template group is a parent event template together with its child event templates; the parent still appears as its own row because it is sold too.
Filters
| Report | Filters |
|---|---|
| Product Sales | Tag, Product, Event, Event template, Template group, Admission, Price category, POS, Order channel |
| Voucher Sales | Voucher, POS, Order channel |
| Attendee Sales | Tag, Product, Event, Event template, Template group, Admission, Price category, POS, Order channel |
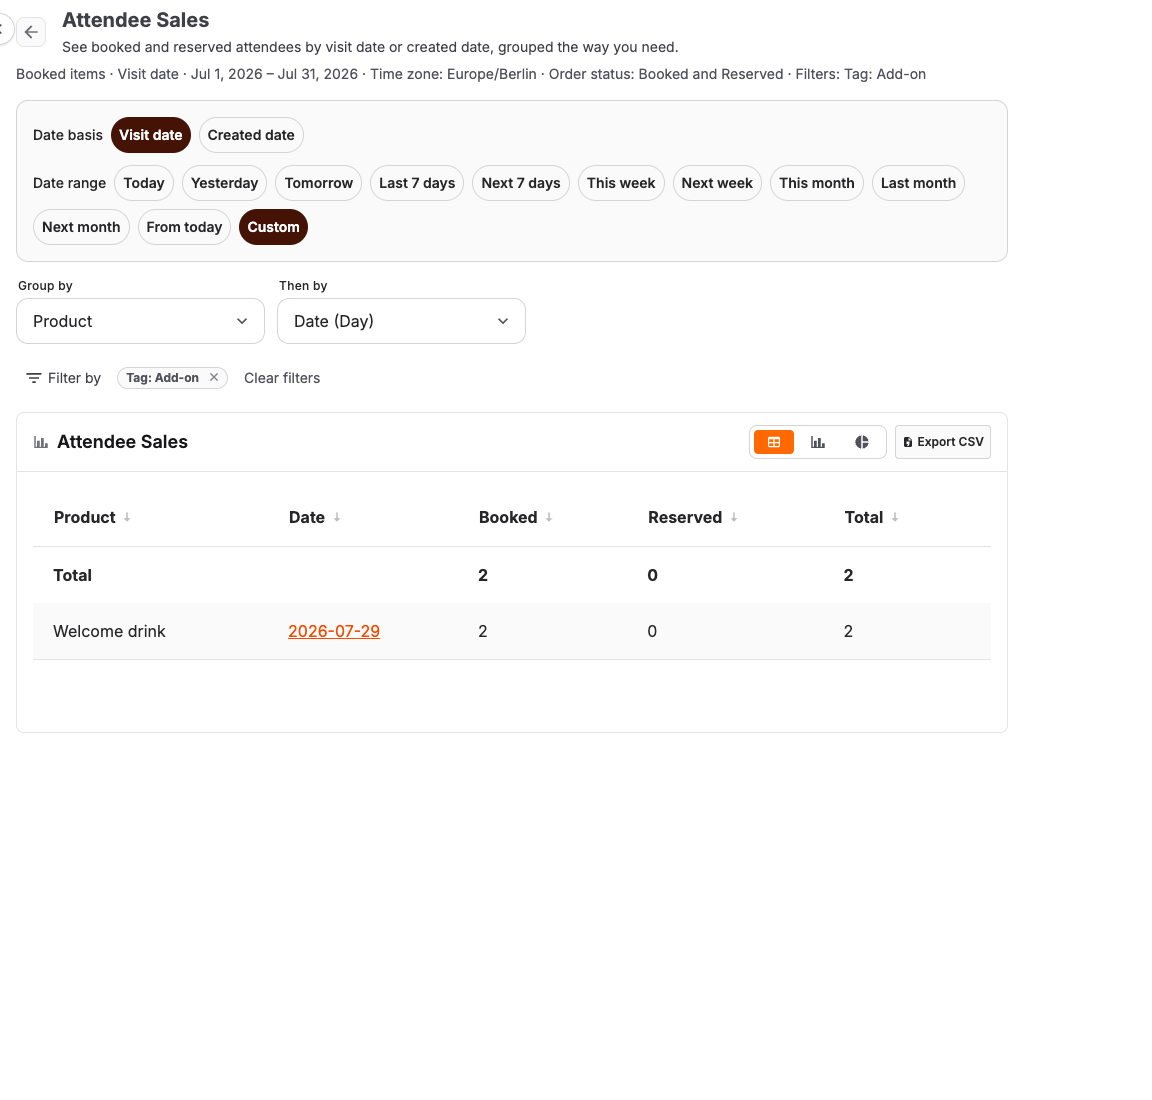
Select Filter by above the table, choose a category, then choose one or more values. Each choice appears as a removable chip; select a chip's remove button to drop that one value, or select Clear filters to remove every filter at once — the date range and grouping stay as they were.
Choosing more than one value in most categories widens the match: any row with at least one of the chosen values qualifies. Tag works the other way around: choosing more than one tag narrows the match to items that carry all of the chosen tags, and the filter bar shows "Has all of these tags:" as a reminder while more than one is selected. A tag can come from the event, its event template, the admission, or the product, so one Tag filter can match through any of those four records.
Template group and Event template answer different questions. Filtering by Template group matches a parent event template together with every child template under it — useful when child templates vary by date but should be counted together. Filtering by Event template matches one exact template only, parent or child, and leaves the rest out.
The line under the heading lists every active filter and its values, for example "· Filters: Tag: Add-on; POS: Shop". A category with more than three values shows the first three plus "+ n more", with the full list available in a tooltip. With more than one tag selected, the category reads "Tag (all of)", for example "· Filters: Tag (all of): Add-on, Drinks", so the line and the file both show that only items carrying every listed tag are counted. Export CSV always lists every filter with every value in full, one filter per line, so the file states exactly what it covers even when the screen shows a shortened list. When a filter leaves no matching rows, the report shows "No results for these filters" with a Clear filters action, instead of the ordinary empty-report message.
Time zoom
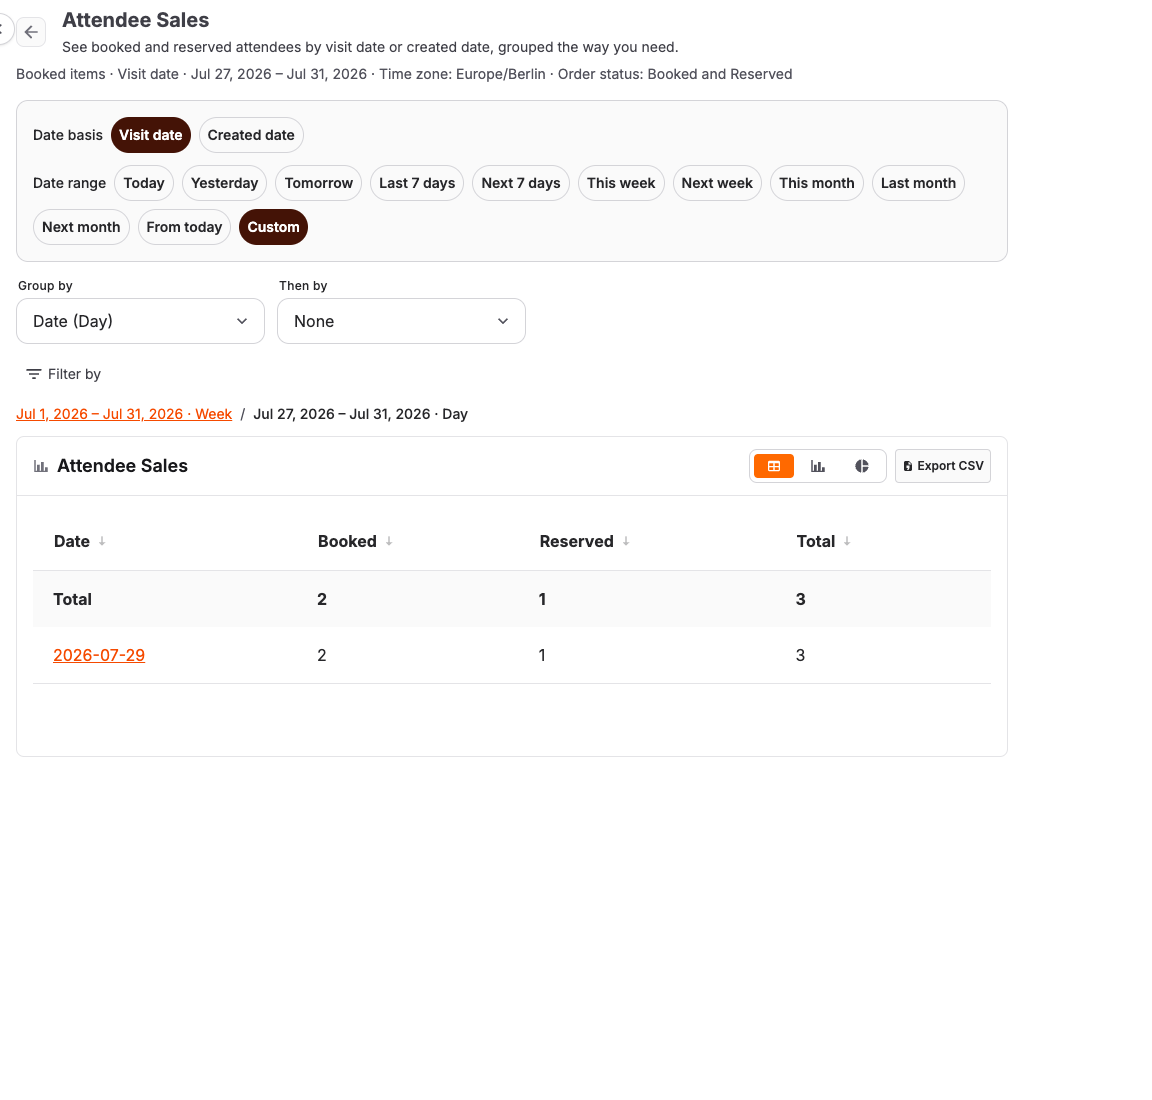
When a report is grouped by date, select a row to look closer: Month narrows to Week, then Day, then the exact start time. A trail above the table lets you go back a level; weeks start on Monday.
List every day with its hours
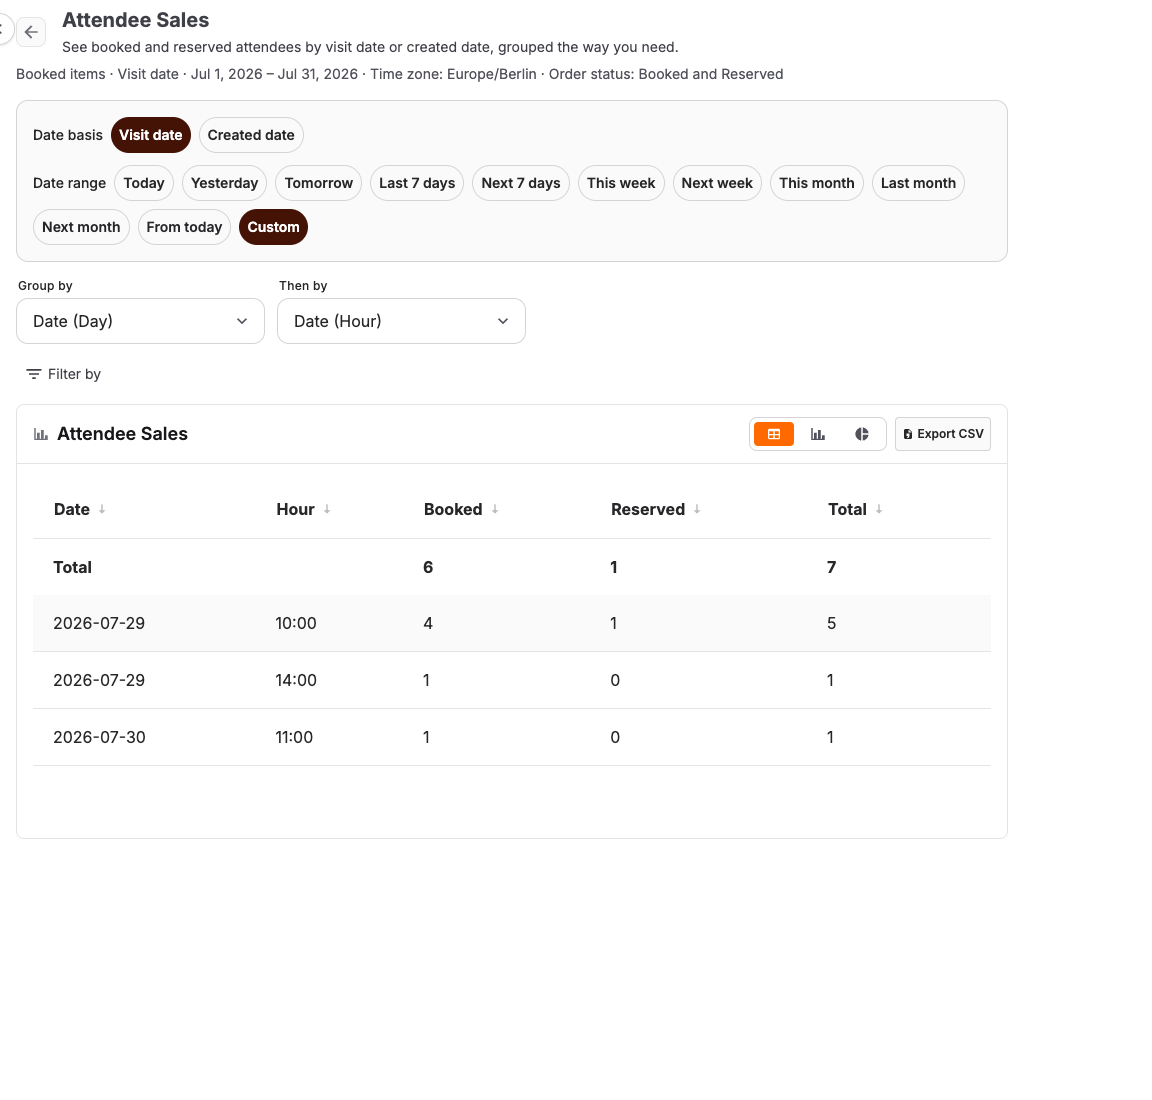
To see every day in the period together with each of its hours, group by Date (Day), then by Date (Hour). Choose Date (Start Time) instead of Date (Hour) to list the exact start times under each day rather than the hour. Grouping by Date (Hour) on its own, with no Date (Day) first, answers a different question: it adds every occurrence of that hour across the whole period into one row — for example, every 11:00 on any date, added together. Rows in a day-then-hour or day-then-start-time report do not zoom further, since the finer level is already on screen. The date and time columns are headed by their own level — Date, Week, Month, Hour, or Start Time — matching the Group by and Then by you chose.
Attendee Sales counts
Attendee Sales opens grouped by Price Category, then by Price charged, and shows Booked, Reserved, and Total columns. Open carts, requests awaiting approval, expired orders, and canceled orders are not counted.
To prepare add-on stock for the coming week: on Attendee Sales, choose Visit date and the Next week date range, filter Tag to your add-on tag, then group by Product, then by day. Select a day's row to zoom in to its exact start times, so you know how many of each add-on to have ready for each session.
Export and sharing
Export CSV produces the same columns, in the same order, as the table on screen, preceded by lines stating the report, date basis, period, time zone, order status (Attendee Sales only), and when the file was generated. The page address captures every setting, so a report can be bookmarked or shared; an older link that still names a month opens, using the matching date range.
How the report builder works
Where enabled for your account, list pages such as Products, Vouchers, Events, Event Templates, and Admissions show a Reports button that opens Configure Report. The Products and Vouchers panels offer a preset — Products Sold by Price Charged and Vouchers Sold by Price Charged — that mirrors the default grouping on Product Sales and Voucher Sales. The Attendees panel offers a separate preset, Attendees by Price Charged, that groups by price category and the price charged for the ticket; you can still build a custom report on any of these panels. Select a table heading to sort the visible rows by that column; select it again to change the direction or turn sorting off. For roles that can read the item record, product and voucher numbers use the same preview links as their back-office lists: hover or focus to preview, or select the number to open the record. For other report readers, the number remains visible without the preview link. To continue from a report row, hover over or focus the row and use the action at its end. The attendee action opens the matching attendee list; the product and voucher actions filter the current report to that item — select Clear filters to remove it. For a custom report, pick a Metric, a Break down by dimension (on service lists the Report scope is fixed to that list and you pick a Compare by dimension instead), and a Time interval for date breakdowns, then select Generate Report. Results display as Table view, Bar chart, or Pie chart; a table exports with Export CSV, and a chart exports as an image with Export Image. A report opened from a list respects the filters currently applied to that list.
Understand price charged and quantities
- Price charged is the price quoted for the ticket, product, or voucher before any discount, recorded at the time of the sale. Reports group by this figure, never by the price paid after a discount.
- A row with no recorded price appears as No price recorded instead of being placed in a misleading price bucket.
- Product and voucher reports use signed quantities. Sales increase the total; returns reduce it. A return is grouped with sales at the same price-charged magnitude.
- Monetary report rows use their own currency. Tables show a separate total for each currency, charts identify the currency of each monetary series and tooltip, and CSV exports use major currency units with a Currency column. Amounts in different currencies are never added into one total.
When you group attendees by Price Category, attendees that are not connected to a price category appear as No price category. This keeps imported or manually created attendance records in the total instead of dropping them from the report.
Expected result
You can name the surface, metric, and breakdown that answers the question before you open anything.
Troubleshooting
| Problem | What to check |
|---|---|
| No Reports button on a list | Report availability for your account, and your permissions for that list. |
| Product or voucher reports are not visible | Confirm that your role can read invoices and is not limited to assigned resources. |
| A price-charged report has fewer rows than expected | Check whether older attendees have a recorded price and whether revenue lines have a non-zero quantity. |
| Two surfaces disagree | Date basis, list filters, canceled or free items, and POS versus online sales. |
| Need check-in or capacity numbers | Use the dashboard for the booked-versus-checked-in ratio, the attendee list for check-in detail, and the event capacity diagnostic for capacity. |
| A Sales report shows no rows | Select Clear filters, or remove one filter at a time to see which one drops the matches to zero. |